
Technical analysis is a trading discipline employed to evaluate investments and identify trading opportunities by analyzing statistical trends gathered from trading activity, such as price movement and volume. Unlike fundamental analysts who attempt to evaluate a security’s intrinsic value, technical analysts focus on charts of price movement and various analytical tools to evaluate a security’s strength or weakness.
Key Concepts in Technical Analysis
1. Trend Lines
In technical analysis, trend lines are a fundamental tool. A trend line is a line drawn over pivot highs or under pivot lows to show the prevailing direction of price. Trend lines are a visual representation of support and resistance in any time frame.
2. Moving Averages
Moving averages are another key tool in technical analysis. They help smooth out price data by creating a constantly updated average price. The average is taken over a specific period of time, like 10 days, 20 minutes, 30 weeks or any time period the trader chooses.
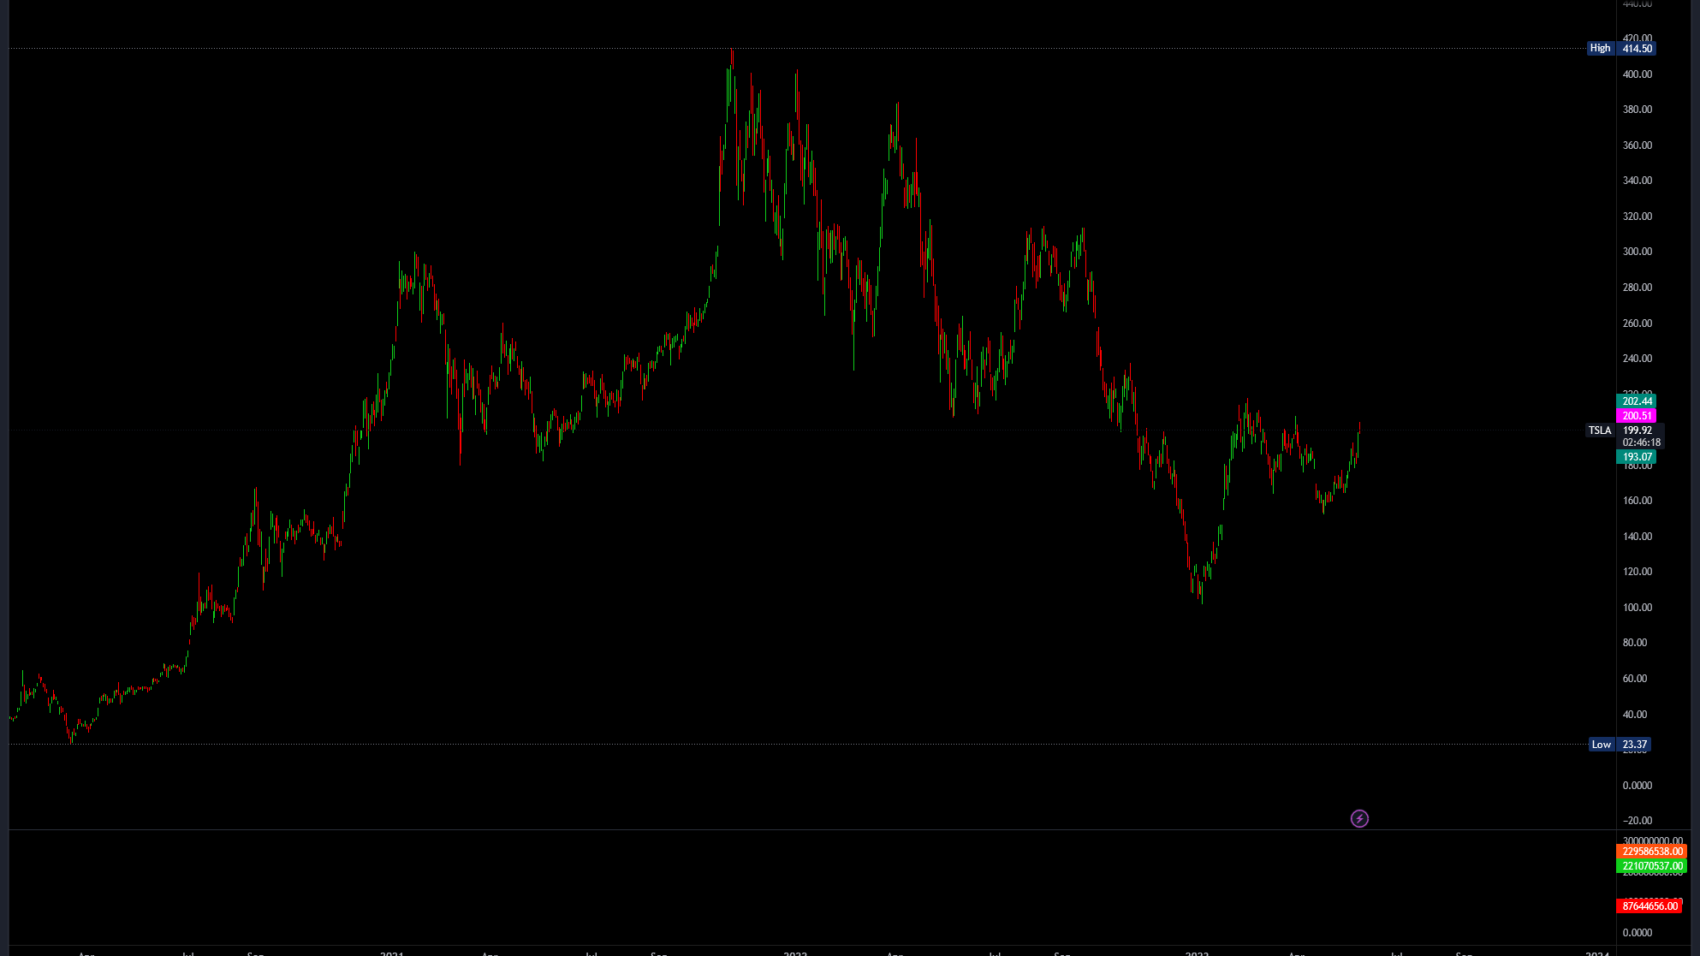
3. Volume
Volume is one of the most basic and beneficial concepts to understand when trading stocks. Volume is defined as, “the number of shares (or contracts) traded during a given period of time.”
Pros and Cons
Like any strategy, technical analysis has its pros and cons. On the positive side, it allows traders to make sense of price movements, identify trading opportunities, and time their entries and exits. On the downside, TA can become complex quickly, and there is no surefire way to guarantee results.
Technical analysis is a powerful tool in the trader’s toolbox. From the basic concepts of trend lines, moving averages, and volume, traders can develop a range of strategies to help them navigate the market. While TA has its pros and cons, the benefits can often outweigh the challenges and save you a lot of money when used correctly.